
The 9/21/50 EMA Stack, Explained
The 9/21/50 EMA Stack, Explained
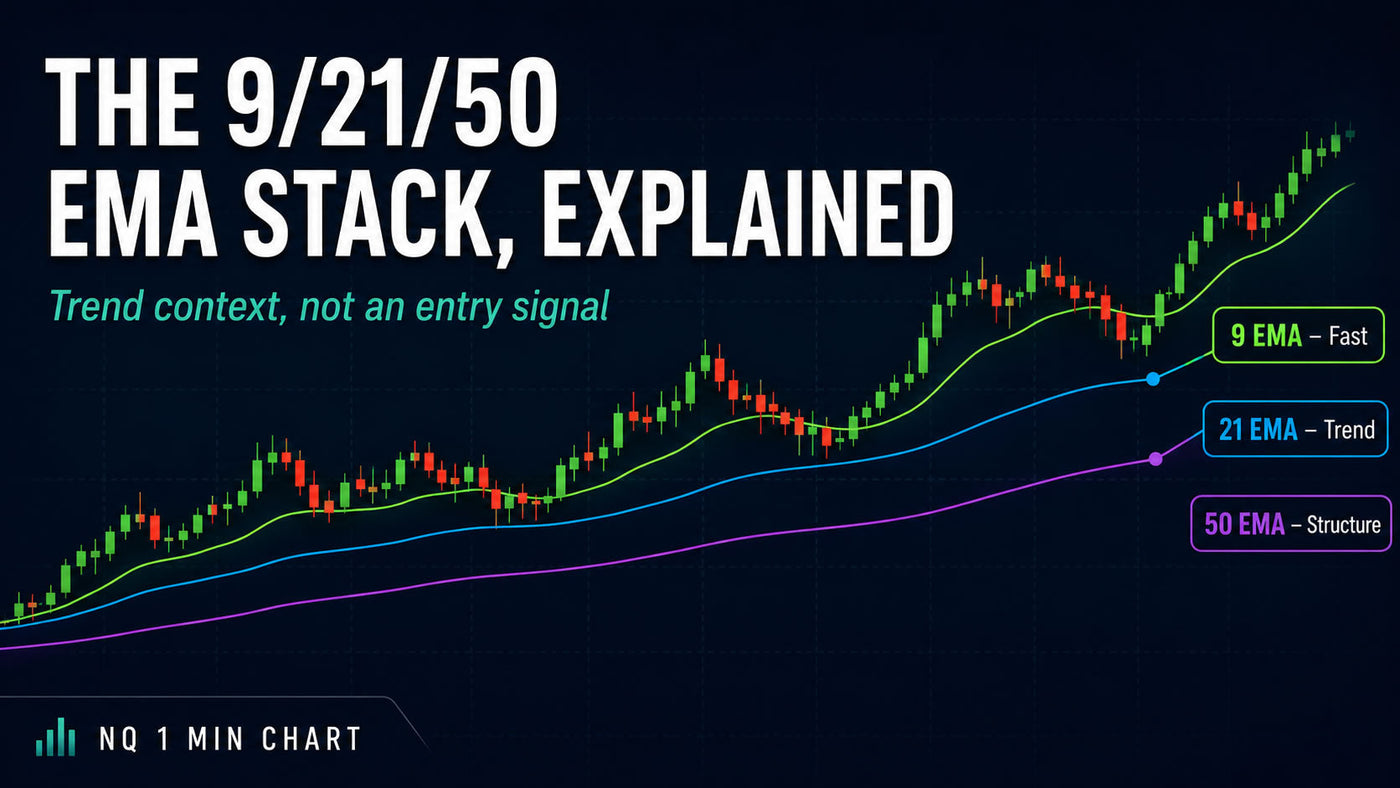
I use the 9, 21 and 50 EMAs on most of my intraday charts, not because I think there is anything magical about those exact numbers, but because together they give me a quick read on what sort of market I am looking at. You could change them slightly and the market would not suddenly stop working. What matters to me is having a fast average, a medium one and a slower one that, when viewed together, make it easier to see whether price is moving with some structure or simply chopping around.
The 9 EMA reacts quickly and normally stays closest to price, so I mainly use it as a rough guide to short-term momentum. In a strong move, price can spend a lot of time holding above it in an uptrend or below it in a downtrend, with relatively shallow pullbacks. I am not buying or selling because price touches the 9, but I do pay attention to how comfortably the market is holding around it. If price keeps losing it, reclaiming it and crossing backwards and forwards through it, that usually tells me the move is not as clean as it first looked.
The 21 is the EMA I probably pay the most attention to on the one-minute NQ chart. During an established move, price will often pull back towards it, reset and then continue without completely damaging the underlying structure. That does not mean the 21 is some automatic support or resistance level, because plenty of times price will go straight through it. I use it more as a reference point for whether a pullback still looks reasonable within the wider move.
The 50 gives me more of the background. If the 9 and 21 are technically bullish but are constantly crossing backwards and forwards through a flat 50, I am normally looking at a messy market rather than a proper trend. You can still get decent individual moves in those conditions, especially on NQ, but they are harder to trust and much easier to get chopped up in. When all three averages are moving in the same direction with some separation between them, the chart usually becomes much easier to read.
What I mean by a stacked EMA setup
A bullish stack is simply the 9 above the 21, with the 21 above the 50. A bearish stack is the opposite. That is the textbook definition, but I do not think the order alone is enough to tell you whether the market is actually worth trading.
You can easily have all three EMAs sitting in the correct order while they are almost completely flat and bunched together. Technically, that is still a stack, but in practice it tells me very little. The cleaner setups usually have some separation between the averages and a clear slope in the same direction. In a good bullish trend, the 9 leads, the 21 follows underneath and the 50 rises below both of them. Pullbacks might bring them closer together for a while, but the overall structure still looks organised.
When the market is chopping, the whole thing looks very different. The averages flatten out, repeatedly cross each other and spend most of their time tangled together. That is why I stopped treating every EMA alignment as though it meant the same thing. A clean, expanding stack after a genuine move is very different from three flat lines that happen to be sitting in the right order.
The stack is a filter, not an entry
This is the part I think gets misunderstood most often with EMA strategies. I do not buy because the 9 is above the 21 and 50, and I do not short simply because they are stacked the other way. By the time the averages are perfectly aligned, price may already have travelled a fair distance, so entering purely because the chart suddenly looks tidy can put you in at exactly the wrong point.
I use the stack to decide which direction currently has the cleaner conditions. After that, I still need an actual reason to enter. That could be a break of structure followed by a pullback, a failed attempt to reclaim the 21 after a move lower, or a liquidity sweep that resolves back in the direction of the wider trend. The EMAs give me the backdrop, but price structure still has to give me the trade.
That also means there are plenty of times when I will ignore a setup even though the averages are technically aligned. Price might be extended, the move might be running directly into a major level, or the higher timeframe might simply be telling a different story. The EMA stack is there to help me read the conditions, not to make the decision for me.
The fact that EMAs lag does not bother me either. They are based on prices that have already traded, so obviously they are not going to identify the exact top or bottom before it happens. I am not using them for that. I would rather have some confirmation that a move is genuinely developing before I start looking for continuation trades, even if that means missing the first part of it.
I have spent enough time trying to catch reversals early to know that being first into a move is not particularly important. I am much more interested in the middle of the trend, once the market has started to establish some structure but there is still enough movement left to make the trade worthwhile. For that type of trading, a lagging indicator is not necessarily a disadvantage because I am looking for confirmation rather than prediction.
Compression matters just as much as alignment
One of the most useful things about having all three EMAs on the chart is being able to see when they start compressing. When the 9, 21 and 50 bunch tightly together, it usually tells me the market has lost direction and I need to become much more selective.
That is especially useful on NQ because the one-minute chart can still look incredibly active while the underlying conditions are awful. You can get a strong push higher, followed by an equally strong move lower, then another breakout that goes nowhere. There is plenty of movement, but very little structure. In those conditions the EMAs normally flatten and start weaving through each other, which is often a better warning than anything the individual candles are showing.
Those are also the conditions where I am most likely to overtrade. A candle suddenly looks strong, I convince myself the market is breaking out, and thirty seconds later the whole thing has reversed. When the averages are compressed, I know I need to be more cautious. When they start separating and sloping together, that is when I become more interested in looking for continuation.
Why the 9/21/50/200 stack ended up in Wave Rider
The 9/21/50/200 structure became part of Wave Rider because I was already using it manually for exactly the same reason: I wanted a quick way of judging whether the market was actually behaving in a way I wanted to trade.
The EMAs are only one part of that. I also want to see a meaningful break of structure rather than price simply drifting higher or lower, I want some participation behind the move, and I want the lower timeframe setup to make sense against the broader timeframe. A bullish EMA stack on its own tells me very little, but if the averages are aligned, structure is breaking in the same direction and the higher timeframe agrees, the setup becomes much more interesting.
None of that predicts what happens next and it certainly does not remove losing trades. What it does is help me avoid some of the conditions where I know I tend to make poor decisions.
That is really how I think the 9/21/50/200 EMA stack is best used. It is not a crossover system and it is not a reason to blindly buy or sell every pullback to a moving average. For me, it is simply a quick way of looking at a chart and deciding whether the market is trending cleanly, starting to lose direction or sitting in the sort of mess I would probably be better off leaving alone.
Want this read on your own chart?
Wave Rider marks the structure, the EMA stack and the levels automatically — live, on any market you trade.
See Wave Rider → Or start with the free onesCharting and analysis only — nothing here is financial advice. Trading involves substantial risk of loss.